
Secondary school leaders would like to think that they are judged on the difference they make and not on the pure outcomes of their school irrespective of context. The whole language of the most recent framework is about progress made, taking into account pupils and schools various starting points. While there has to be regard to national average attainments, there is a general sense that Ofsted inspectors try to take into account starting points when judging a school.
But are they succeeding? For example, do those schools which have low prior-attainment intakes have that taken into account properly? Do those with very able intakes get the appropriate challenge from Ofsted? In a previous post, focusing on Grammar Schools and Secondary Moderns, the evidence seemed to be saying no. It was unusual that Secondary Moderns had a very wide spread of prior attainment, so I wondered whether Ofsted grades might be linked not just to the selectivity of intake, but to the prior attainment of intake.
Simply, yes! There is a high degree of correlation between a secondary school’s average KS2 points score (for the Y11 cohort in 2013) and the Ofsted grade most recently awarded. Here’s what it looks like …

Ofsted Grade by Prior Attainment as of 30 April 2014
A few notes of explanation:
- These are the 2,684 secondary schools in England with both a KS2 prior attainment score and a current Ofsted grade.
- 85% of these schools have a KS2 average point score (APS) of higher than 26, but lower than 30 i.e. the four columns labelled 26, 27, 28, 29 in the chart
- The number of schools in each APS “bucket” is shown at the top of the bar so there are 748 schools with KS2 APS of 27 or higher, but less than 28.
You can see that there is a far higher likelihood of a school with higher attaining pupils getting an Ofsted Outstanding than there is of a school with low attaining pupils from primary school. For example, look at the 462 schools in the KS2 APS=26-27 band. Just 9% of those schools are outstanding. By contrast, 48% of the 133 schools in the KS2 APS=29-30 band are outstanding. Those schools are five times more likely to be Outstanding. The figures for Good or Outstanding for those two are almost as stark: 91% versus 54%. The schools with the higher attaining intake are nearly twice as likely to be Good or Outstanding.
What about RI & Inadequate schools? 46% of the APS=26-27 band are in Ofsted grades 3 or 4, as opposed to 9% of those in APS=29-30 band (none of which are Inadequate). The schools with the lower intake are five times as likely to be RI or Inadequate.
So what is the explanation? Well, here are a few pre-digested ones to pick from:
- It’s just a coincidence. Correlation doesn’t prove causation. Don’t get so worked up! (I don’t find this convincing, do you?)
- Schools with able intakes attract the best teachers and leaders so it is no surprise that they are more likely to be graded better. (Are you bristling at this?)
- Schools with able intakes are more likely to have pupils with the middle class values that prize education, making it easier to demonstrate the sorts of things inspectors want: good behaviour, strong progress, a thirst for knowledge.
- Prior attainment is not the only variable that is different between schools with different prior attainment intakes. Something else varies across schools of different prior attainment bands which influences school quality – this is known as a confounding variable. (What could that be? Social class? Something else?)
- The Ofsted framework is biased against secondary schools with weaker intakes and expects more of them. (I’m not suggesting it is biased by design, just by implementation).
- Inspectors cannot help being seduced by the Halo Effect and don’t expect enough from schools with more able intakes because they have such lovely, articulate and well-socialised pupils.
Perhaps you can think of some more. My favourites are 5 and 6, though I think that it is hard to be too upset by number 5. If schools are to address disadvantage, that’s just how it has to be. However, that therefore means the inspection process is biased and inherently unfair on some schools, their teachers and leaders. Ofsted do seem to expect more of those who have less, in a kind of anti-Matthew effect. The longer term consequences of this for the schools affected aren’t good.
Wait! I know some will cry. Ofsted put a new framework in at the start of 2013, so it is not fair to use historic data on inspection, particularly when you are mixing it with 2013 KS2 APS scores. Yes, you’re right. Here’s the same chart just with Ofsted grades awarded since 1 September 2013.
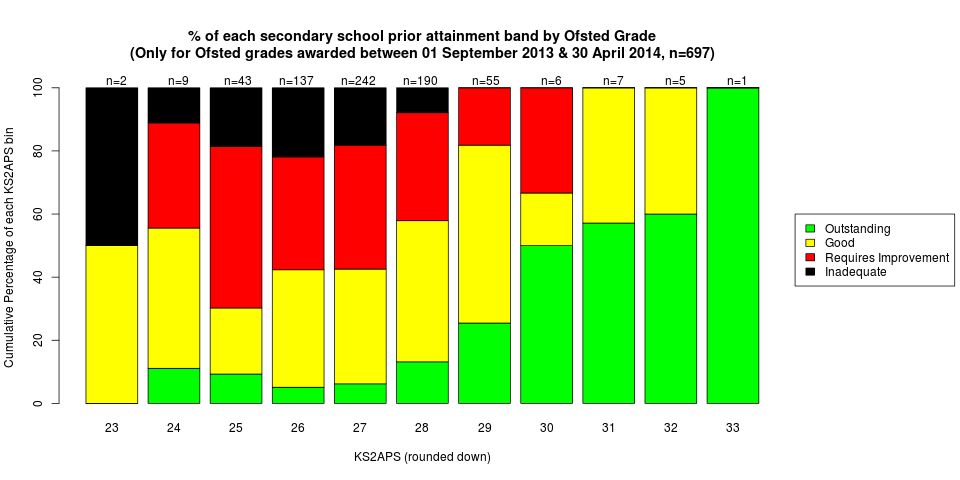
Ofsted Grade by Prior Attainment since 1 September 2013
Not much difference. Overall a bit harsher, and the prior attainment effect is slightly weaker, but still strong. Band 26-27 schools are half as likely to be Outstanding and three times as likely to be RI or Inadequate as the band 29-30 schools.
Oh, what how about the slight amendments since 1 January 2014? You should really look at those. OK, here they are.

Ofsted Grade by Prior Attainment since 1 January 2014
We’re down to only 242 schools now, and my two favourite bands comprise 57 and 20 schools respectively. With these recent inspections, band 26-27 schools are one-seventh as likely to be Outstanding and twice as likely to be RI or Inadequate as the band 29-30 schools. That’s a big difference.
All these bands are complicated, so let’s split schools into two halves in terms of their last year’s Y11 Key Stage 2 point scores (chart below). If you were lucky enough to have “clever” Year 6 pupils join you in 2008 who gained their GCSEs last year, your school would be 3.5 times more likely to have an Outstanding grade (34% vs. 10%) compared to schools with KS2 APS below the median. It would also be less than half as likely to be an RI or Inadequate school (19% vs. 43%).

Ofsted Grade by Prior Attainment as of 30 April 2014
So, it is easy. If you want your secondary school to get an Outstanding Ofsted grade and you want to avoid RI or Inadequate, make sure your pupils’ previous attainment on intake is as high as possible.
Depressingly, this is our accountability system. This is why it is getting difficult to recruit good people to struggling schools. The odds are against them in more ways than the obvious ones.
As an organisation Ofsted has encouraged us to self-evaluate for many years, but how far is it evaluating its own biases? Have Ofsted looked at themselves like this? If not why not, given that they employ an Inspection Data & Insight Team of 100 staff? I’ll let you know if I get an answer.
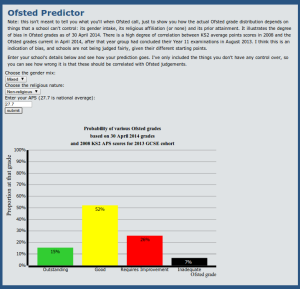
Ofsted Grade Predictor
Meanwhile, cheer yourself up by finding out the probability of your school getting each grade by using this handy Ofsted Grade Predictor! I took the unchangeable data (KS2 APS, religious nature and gender basis) of schools and modelled the Ofsted grades using those as predictors. Of course, inspections are too complicated to predict from just those items (I purposely didn’t use outcome data which any inspector would), but really, the point is none of these should be expected to influence inspection grades? Play around to see what you have to do to get the grade you want … or fear.
Technical notes:
The 2013 KS2 APS came from the DfE performance tables website – data download area
The most recent Ofsted grades came from Ofsted’s Monthly Management Information area
All the schools with no inspection data (mainly recently converted academies) were removed from the dataset. This left 2,684 secondary schools with both a KS2 APS score available and an Ofsted grade. 697 of these had been inspected since 1st September 2013, and 242 of those since 1st January 2014.
I’m happy to send you the R code I used to create the charts if you drop me a line.

Reblogged this on The Echo Chamber.
LikeLike
Isn’t it also the case that higher achieving children make on average faster progress so have a school full of higher achieves and you get great progress too? And vice versa.
LikeLike
Hi Claire,
Yes, but this should be taken account of by “taking into account their different starting points”. Inspectors should judge the higher progress by the level 5s as what is expected from them. What will be interesting is how this pans out in the future as national curriculum levels are removed. and we just have to trust Ofsted.
LikeLike
Very interesting article. I always suspected it was the case, but it’s amazing to see it in black and white (or green and red).
I never understood why L6 disappeared for a while. I think if they had kept that measure in place and expected all L6 pupils to get A/A* then we’d have a fairer system. At the moment L5 pupils need to get a B or above – which is not that challenging if we’re honest.
LikeLike
This raises an interesting question but I don’t think the results are surprising or necessarily problematic. In fact it’s probably would you’d expect in an inspection system applying standards evenly. Schools with higher attaining intakes will be relatively easy to run – there is a virtuous circle effect where higher attainment links with stronger parental support, lower levels of difficulty with behaviour and so on. You’d expect those schools to perform well and to do better on average than schools with a lower starting point – with the same quality of teaching. It would be a worry if they didn’t because it’s easier to do. However, the critical thing in your data is that schools can be outstanding regardless of their prior attainment data; in fact many more of them are outstanding than those in the higher bands. The sample sizes are very different so the use of ‘likelihood’ is a little problematic. In a sample of several hundred schools, it’s inevitable that a higher proportion of the lower attaining intakes will find it hard to create the virtuous circle than the higher banded schools can.
Should OfSTED vary the standard? It’s hard to set a higher bar for the higher intake schools because GCSE outcomes have ceiling effects and there are only so many levels of progress a student can make in the system. If that ceiling effect was lifted, then we’d see greater gaps in rates of progress. The halo effect may be an illusion as you suggest but it could also be real and hard to exceed for some schools. Alternatively, should a lower bar be set for schools with lower prior attainment? There would be a stronger case for that if fewer schools gained outstanding but, as you’ve shown, hundreds of schools manage it and probably keep the bar high for everyone else. Another question would be what distinguishes those schools that are good and outstanding with the same prior attainment as others graded RI.
Sorry for long reply – you got me thinking.
LikeLike
Imagine you said to one of your teachers “Well, I’m sorry Fred, but I don’t give out many outstanding performance management to teachers who teach the bottom sets, because their pupils don’t reach the high standards that the pupils from the top sets do. It’s those top set teachers who get the outstanding performance management grades. Perhaps you should apply to teach the top sets. Good luck with the interview.”
I think that is why I have a problem with it. I don’t think it helps with the headteacher recruitment crisis either. By the way, prior attainment in my school is significantly above average, so it isn’t a personal issue for me.
As far as sample sizes go, I’ve restricted my comments to the 4 central bands which comprise 85% of secondary schools and the smallest sample there is 277, and the other three are above 400 which is pretty large statistically. Confidence bands would be around +/-5% on each cumulative frequency.
You say hundreds of schools with lower PA manage Outstanding, but that’s not what my figures suggest. Out of the bottom half of schools by PA (1317 schools) about 130 manage Outstanding. Out of the top half of schools on PA, about 400 schools manage it. Three times as many.
The crucial question is what the Ofsted framework is measuring. Is it absolutes, or is it about difference made and progress achieved. If absolutes, then we’re judging schools’ efforts on a proxy for social class. We might as well tie Ofsted grades to deprivation scores and save all those inspector salaries! If it is on difference made, school leaders must not expect any recognition for efforts in a challenging school.
I’m not actually sure which is the right thing for the Ofsted framework, but this bias doesn’t sit easy with me.
LikeLiked by 1 person
I know what you’re saying – it’s an important issue. I don’t think OfSTED is meant to be comparable to a teacher’s performance in that way you describe. Yet that is definitely an issue – it can be harder to secure progress in more challenging sets and schools that don’t take account of that in performance management are doing teachers a disservice.
The question is whether absolutes or relative performance at school level would lever the greatest improvement in the end. I think the fact that 130 schools with lower-half PA get Outstanding is significant and lots of top-half PA schools don’t. It’s not a fait accompli. On the issue of likelihood, from your data, of all the schools that are Outstanding, what % fall into each PA category? It looks to me that the middle bands would be highest – is that right? That makes ‘likelihood’ a different question. I may have missed the fact that you’re not referencing the extremes. If some bars are samples of a few schools, it does distort the data – that was my point about samples and saying ‘seven times as likely’.
RaiseOnline has VA scores for lower,middle and upper bands of PA -that should give OfSTED some indication of progress issues relative to intake. I know some schools do much better in VA terms with the lower PA students; some have it the other way around. Context is key there. What are the features of low PA schools that achieve top VA scores and top OfSTED grades? That’s the question – because it clearly isn’t unattainable.
Personally I think that Good/Outstanding is a dubious distinction in most cases and I’d do away with it; also all schools require improvement relative to their context. Another thought – If higher PA schools found it harder to get Outstanding than others, there would be a lobby to make exams more difficult at KS4 – because A* is a ceiling at present. If that ceiling went, they could show more VA and things would stretch out further. There’s got to be an equilibrium somewhere. If schools did better in general with lower PA intakes there would be a perverse disincentive to make outcomes higher at KS2; from your data, it suggests that it is currently in secondary schools’ interests to work with feeders to maximise outcomes.
Thanks for putting the data together – very thought provoking.
LikeLike
Shall we not just accept that fundamentally its down to class! On average you are more likely to succeed if you are from a well off family. Not because you are inherently more intelligent, it’s just that life is a bit easier for you. The sooner the born to rule in-breds are run from office the better
LikeLike
Reblogged this on paulbanks1974.
LikeLike
What an excellent piece of work, shattering government myths nd, sadly, supporting anecdotal evidence.
LikeLike
An observation – your comment: “Depressingly, this is our accountability system. This is why it is getting difficult to recruit good people to struggling schools. The odds are against them in more ways than the obvious ones.” suggests that you do actually support hypothesis 2: “Schools with able intakes attract the best teachers and leaders so it is no surprise that they are more likely to be graded better. (Are you bristling at this?)”. Please update your favourites! 🙂
LikeLike
Value added figures are interesting, too. I have a girl with “B” on her KS2 stats. The DfE say that this must equate to a level 2 for statistical purposes. We are doubly penalised, firstly because she cannot make progress at the standard rate and secondly, she now needs to progress an extra two levels.
And as for the best teachers at the schools rated Outstanding, my experience would contradict this. If your intake is bright, their exam results will show progress, therefore the teaching must be outstanding.
LikeLike
It is a really useful analysis, and I hope you are going to publish it somewhere. What would you think, though, about the idea that prior attainment is statistically controlled in generating OFSTED outcomes measures? Or at least that such a measure would be put alongside the standard grading as a more objective value-added measure. That could be a response couldn’t it? For me, this would be beside the point – the problem is the whole inspection culture and how it distorts education, not just that it has biases of this sort.
LikeLike
I think I have mixed views. As a head, I would like to be judged on the difference I make given where the young people at my school are starting from – this is how I feel Ofsted should report. However, what makes the ultimate difference for young people is the end point of their achievement, regardless of how much progress they’ve made. That’s why I think there are no easy answers. Maybe “Leadership & Management” should be judged on the difference made, and “Achievement” judged on absolutes. I think that would satisfy me!
LikeLike
I have replied already to your stunning work. Ok if I use quote your data in my blog? Headlines Dennis O ‘Sullivan. Should I credit you as Eating Elephants or is there an address?
Dennis O’Sullivan
LikeLike
Hello Dennis, my name is Trevor Burton and you might mention my twitter handle @JTrevorBurton. Thanks!
LikeLike
Trevor My 26th blog will be using your Ofsted data in a manner similar to Blog 25 which has proven timely and popular today. Please retweet if impressed; accept apologies if not. Dennis O’Sullivan
Headlines: The Dennis O’Sullivan Blog: End of Term Report: Go Now Michael Gove, Make Haste, But Quietly Please
LikeLike
Reblogged this on Mat Weldon's Notebook and commented:
I should write a proper response to this and link to it but its so good I’m just going to reblog it.
LikeLike
An excellent piece of research – like others, I’d like to use your results on my blog – with credit to Trevor Burton @JTrevorBurton of course.
LikeLike
Thank you. I’m very happy for you to mention it on your blog.
LikeLike
new blog
https://www.the-newshub.com/uk-politics/the-last-thing-that-teachers-need-is-a-politician-with-vision
[https://res.cloudinary.com/the-news-hub/image/upload/q_60,f_auto/v1461779236/c5frbb8rrromgul7kphf.jpg]
The Last Thing That Teachers Need Is A politician With Vision | UK Politics | The News Hub http://www.the-newshub.com As Tory education policy unravels, we can but hope
Dennis O’Sullivan
Headteacher
Chauncy School
email head@chauncy.org.uk
phone 01920 411200
07812912335
________________________________
LikeLike
Pingback: The OFSTED Collection | @LeadingLearner
Pingback: Edubabble – Choosing a secondary school: a teacher’s guide for parents
Very interesting statistics.
Have you looked into the correlation between PA and value added? You’re data and argument suggests that all schools across the spectrum will have equally distributed VA data which makes the Ofsted judgements unfair. However, if the VA data was seen to correlate with PA could that justify the findings? For all we know Ofsted gradings correlate perfectly with VA- which is as I understand it, what you would deem ‘fair’.
LikeLike
*Your
LikeLike
Well, I take your point, but a proper value-added which used PA as its baseline must not be correlated with PA. That “must not” is a statistical requirement rather than a fond hope. The only way it could be would be if value-added was based on a variety of factors, e.g. FSM and PA, and one or more of these were correlated, but imperfectly. As far as I have understood it, value-added is based only on KS2 English, KS2 Maths and the standard deviation of KS2 scores within a school. Maybe I’ll get chance to check that in the future. Or maybe the 100 people working for Ofsted’s Data Insight team might apply their statistical might to the question.
LikeLike
Pingback: Choosing a secondary school: a teacher’s guide for parents | Wellfield High School - News
Pingback: Choosing a secondary school : a parent’s guide by a teacher (who is a parent) | Disappointed Idealist
Pingback: A Little Meeting with Ofsted | docendo discimus
Pingback: A plea for the return of complexity and nuance to education policy | Disappointed Idealist
Pingback: The entire schools inspection culture is the problem
From my understanding, what you describe is more of a Matthew Effect, than an Anti-Matthew Effect. The schools that have more, get more credit, the schools that have less, get less.
LikeLike
Pingback: Inclusion benefits all students, so why doesn’t the accountability system encourage it? | Educating Brentwood
Pingback: Ofsted: a briefing paper | Organising Ideas
Reblogged this on Kalinski1970's Blog.
LikeLike
Pingback: The foundations are looking shaky | Disappointed Idealist
Pingback: Is there a ‘cargo cult’ approach to school improvement? | Evidence into practice
Reblogged this on My NPQH and commented:
Unsurprisingly…
LikeLike
Pingback: Blame poverty, not schools part 2 | Reclaiming Schools
Pingback: Grim up north? | Reclaiming Schools
Your answer lifts the ingilletence of the debate.
LikeLike
Pingback: Ofsted : unreliable, destructive, beyond repair | Reclaiming Schools